Our business is making your business smarter.
Powered by marketing science, these tools in our skilled hands will reinforce your most important decisions and improve your bottom line. We elevate your efforts by making them more precise, more adaptive, and more deeply insightful. If we don’t have a solution to your problem, we’ll build you one!


Sharpen Strategy
This set of tools will orientate your business and your products with your customers and consumers relative to your competitors:
Category and Brand Insights | Customer Journey Analytics | Key Performance Drivers | Customer Persona Segmentation | Product Optimization | Competitive Intelligence
Category and Brand Insights
How large is your market? How strong is your brand?

The yield funnel pictured depicts the deeper look at brand awareness that AAU studies deliver — indexing brand familiarity and willingness to consider, and, ultimately, likelihood to actually purchase.
Category Attitudes, Product Awareness and Usage studies (AAU) provide foundational insights into market size, market share, brand strength, and potential within that market.
Designed to track success longitudinally, AAU studies provide the perfect framework to sequentially test hypotheses with marketing experiments, examine results, and consistently improve performance.
Customer Journey Analytics
Where do you have hotspots in your performance?

Journey Analytics “opens up” and illustrates performance experience metrics across the entire customer journey. Here, screening is showing the highest customer satisfaction scores; wellness programs, the lowest.
The devil — and the danger – is in the details. As customers interact across all aspects of your business, they may experience inconsistencies. Absent customer touchpoint statistics, the functional heads in charge of these underperforming aspects of your business cannot see their contributions to key areas of business performance.
Key Driver Engine
Are you performing your best where it matters most?

The implications of performance hotspots are enriched when regressed on key outcome variables such as likelihood of future business — as indicated by the longest tangent in green above. In this case, Availability of Products has the greatest detrimental impact on Overall Satisfaction.
Our dynamic key driver engine uses a number of analytic techniques to isolate those customer journey touch points having the strongest impact on KPIs (such as increasing share of business). With the Key Driver Engine, our clients interrogate their own performance to isolate what’s most important to address and, perhaps even more importantly, what’s not important to address.
Performance improvement efforts are significant investments of resources. All fixes are not equal, making knowing what to fix, job #1.
Customer Persona Segmentation
What customers are most valuable? What segments can you best serve?

The latent-class clustering pictured illustrates the precise preference and potential market opportunity.
Too often, market segments are mere lofty persona descriptions — the problem being they are not actionable. Yes, you can divide your customer base by demographics or geographic regions. But does that help you drive future revenue? Done right, segmentation is predictive — i.e, it can help you discern those distinguishing attributes that relate to intent and action. We achieve this level of meaningful segmentation through preference-based latent clustering — using a combination of quantitative methods such as subject variable model tests which sort and validate your data.
This approach is fortified with in-person interviews which add nuance and account for emotion, so you arrive at well-rounded, market-relevant personas.
Competitive Intelligence
Are you best in class? How do you know?
Because all performance is relative, measurements of your own performance can only take you so far. To know if you are succeeding, and if you are properly allocating resources, you need comparisons which show how your competitors are performing.
Competitive Intelligence systems complement our internal VoC systems, completing the performance assessment picture. Because they share AAU and VoC structures, you can compare brand performance and track it over time.

Product Optimization
What do buyers of your products want most? What should you provide?
Product optimization methods look rigorously at the trade-offs consumers make when they consider their options. Is convenience more important than quality? How important are organic ingredients or American manufacture? And how do these trade offs vary by segment?
Discrete Choice Preference Modeling expresses relative preferences in precise dollar values.
This allows you to intelligently design new products, determine how you stack up against the competition, and price new features.

Based on the multi-nominal logic models that earned Dr. Dan McFaddent the Nobel Prize in 2000, this Discrete Choice Preference Modeling shows which features of an insurance offering would have the greatest quantifiable value to consumers.
Product Assortment Optimization
What product portfolio subset will optimize customer reach?
Adding products adds costs. Deleting products reduces opportunity. By determining the smallest number of products that will appeal to the greatest number of consumers, TURF (Total Unduplicated Reach and Frequency) rationalizes a broad line of products/services.
The algorithm runs questions that prompt multiple answers, generating for every possible combination (1) the percentage of those that desire at least 1 product in the given combination (i.e. reach), and (2) the total number of times products are desired in the given combination (i.e. frequency).

Applying this analysis helped one of the one largest consumer retailers of artificial Christmas Trees in North America solidify its market offering.

Invigorate Campaigns
This set of tools assures your market outreach is efficient and effective:
Look-alike Modeling | Direct Marketing Optimization | Message Testing | Media Testing
Look-Alike Modeling
Who is your next best customer?
The best way to find your next best customer starts with the marked characteristics of your existing customers. This extrapolation is accomplished using data enrichment from customer and prospect data sources.

The best models reflect both sensitivity and specificity and thus have larger area under the curve (AUC).
Typical enrichment can include hundreds if not thousands of characteristics that are introduced into a spectrum of algorithms in search of the best model having the smallest subset of the most predictive variables.
Look-alike model quality ultimately is determined by a curve reflecting
Model Sensitivity - the model correctly predicts that a prospect will buy (true positive)
Model Specificity - the model correctly predicts that a prospect will not buy (true negative)
Message Evaluation
What can you legitimately claim? What’s your strongest message?

Because a message’s power is a product of its value and its uniqueness, this graph depicts the relative message power of different claims. Here “smarter” is the most powerful message.
Message/Value Proposition testing identifies statistically significant marketing claims that conform with the FTC regulations governing truth and advertising.
Once you’ve established those claims, we marshal Louviere’s Maximum Difference Scaling analytics (MaxDiff) to determine which claims resonate most to target populations.
Finally, to isolate the best message, we use regression methods to derive the latent message strength against target outcome variables (such as likelihood to purchase) to isolate the latent messages that are both strong and unique — and thus distinct and powerful.
Media Testing
Which ad tests best? Did your media spend favorably affect ROI?

Pictured: a slideshow snapshot of a targeted responder’s take on a particular ad.
Whether applied to pretest animatics or produced campaigns, our test methods quickly reveal the impact you’re having on your audience. Depending on your needs, they help you cost-effectively build your brand and accelerate lead generation.
Our pretest media research is a hybrid of qualitative and quantitative methods applied to a sample which mirrors your target audience. We can discern the strengths and weaknesses of your campaign before a large-scale launch. We measure effectiveness, recall, and comprehension.
Prime time tests of digital and terrestrial media airings incorporate Google Analytics extracts. Then uplift models are built to determine the significance of exposure and impression — all with the aim of making the media spend optimally efficient.
Direct Marketing Optimization
Are you targeting the right prospects with the right offer at the right time using the best channel?

Cohort Sequence Modeling allows you to market to far fewer people in various ways depending on their need, targeting them with specific promotions to efficiently drive activation.
Tracks a group of people with a shared characteristic over time, analyzing the changing factors in their environment, and continually fine-tuning marketing efforts aimed at them.
For example, a client using direct mail sent over 72 million checks over four years in monthly campaigns without capturing or examining their changing preferences, attitudes, actions, milestones, environment, or choices to improve redemption — which had deteriorated from 8% to less than 2%
Using Cohort Sequence Modeling, the client marketed to far fewer people in various ways depending on their need, targeting specific promotions to efficiently drive activation. Our approach rejuvenated the campaign, surpassing initial redemption levels at one tenth of the cost. Be smarter. Spend less and get more.

Leverage Loyalty
This set of tools indexes and monetizes current and future value:
Net Promoter Score™ | Customer Loyalty Profiling | Loyalty Economic Modeling | Customer Activation
Net Promoter Score™
Your customers say they will refer you. But have they?

To arrive at your Net Promoter Score, subtract your percentage of detractors (customers with likelihood to recommend answers from 0 to 6) from your percentage of promoters ( customers with likelihood to recommend scores of 9 or 10).
Since the mid 2000s, the Net Promotor Score (NPS) has become the most widely accepted performance metric. Knowing how likely your customers are to refer you to others is table stakes — and its construct is straightforward.
While highly useful, NPS has limitations. Those limitations — such as the gulf between recommendation and repurchase — are addressed by our other loyalty solutions.
Customer Loyalty Segmentation
How secure is your current customer revenue?

Measures such as customer satisfaction and Net Promoter Score provide unsatisfactory answers to those questions. Customer satisfaction describes current feelings, not future actions. And Net Promoter Score forecasts referrals — not repurchase.
To confidently predict, and intelligently enhance, future revenue, you need to measure loyalty -- one of the most powerfully predictive metrics. A 5% increase in loyalty can increase profits by 25% - 85% for a typical business. Loyal customers buy more, refer more; they are less costly than new acquisitions and less likely to be bothered by sporadic bad experiences.
And measuring loyalty in this way requires aligning results along two axes – comparison to competition and likelihood of continued business – which are the basis of our distinctive approach.
To confidently predict, and intelligently enhance, future revenue, you need to measure loyalty. That begins with our proven construct shown at the right.
Loyalty Economics Modeling
What’s your ROI from increasing Customer Loyalty?
Every loyalty economics model from every client in every industry irrefutably produces a similar line with a positive slope. Unless contractural obligations mandate sole-sourcing, the more loyal your customers, the greater share of their business you realize.

Customer Acquisition

Are your brand ambassadors getting you new customers?
Our BrandFan solution leverages customer satisfaction surveys to identify strong activists for your brand and convert them into brand ambassadors.
BrandFan is a brand advocacy engine that supplements existing feedback processes and addresses two specific challenges:
How do I make it fun, easy, and rewarding for my loyal customers (BrandFans) to promote me through social media. BrandFan: Word of Mouth addresses this.
How do I turn unhappy customers into loyal customers (BrandFans)? BrandFan Recovery Engine addresses this.

Accelerate Improvement
This set of tools brings home the harvest:
Performance Engines | Reporting Engines | Improvement Engines
Performance Engines
How are you managing your business?
Key Performance Indicators (KPIs) are used to comprehensively evaluate business effectiveness. Collectively, these insights serve as solid set of leading indicators of future revenue streams — measured above in levels and below in trends.
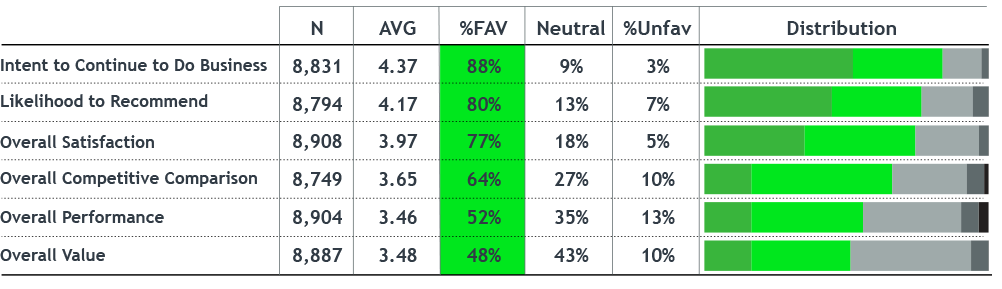
The dashboard illustrates a spectrum of KPIs proven over time to be very indicative of future revenue.
Reporting Engines
Can you interrogate your own research results?

Harnessing data from disparate studies, designed to facilitate clear insight and support decision making, and securely hosted, our reporting engine allows you to dynamically interrogate your own data — when you need to, so you can answer questions that matter to you. We’ve worked really hard to make this really easy. RIP, Powerpoint.
Improvement Engines
How do you make your business perform better?
Ask-Analyze-Align-Act. This performance-improvement methodology helps organizations overcome self-inflicted barriers such as deep-rooted complacency, misalignment of resources, and initiative fatigue.

Are you asking the right questions?
Are the results thoroughly analyzed?
Are your colleagues aligned on around implications?
Are you effectively harnessing your results?
The power to improve your business performance originates with the discipline that extends far beyond asking the right questions. With deep roots in quality technologies, the Ask Analyze Align Act methodology is our proprietary Six Sigma engine for performance improvement. If you’ve invested in the intelligence gathering, assure that it delivers ROI. Using our PI methods, we guarantee it will.
The story of the radium girls

The color that could not be ignored — and the women who would not be silenced.
The women who painted the radium dials used during WWI were told that the radium they ingested was harmless. But when they first started to glow, and then to experience the awful effects of radium poisoning, they raised their voices against great odds. Their case was “one of the first in which an employer was made responsible for the health of the company’s employees. It led to life-saving regulations and, ultimately, to the establishment of the Occupational Safety and Health Administration . . . Before OSHA was set up, 14,000 people died on the job every year; today, it is just over 4,500.
The color isn’t an accident. Neither is excellence.